

How to Test and QA UTM Parameters in GA4 DebugView and Realtime
Learn how to test and verify UTM tracking in Google Analytics 4 before spending ad budget. Step-by-step guide using DebugView, Realtime, and DevTools.
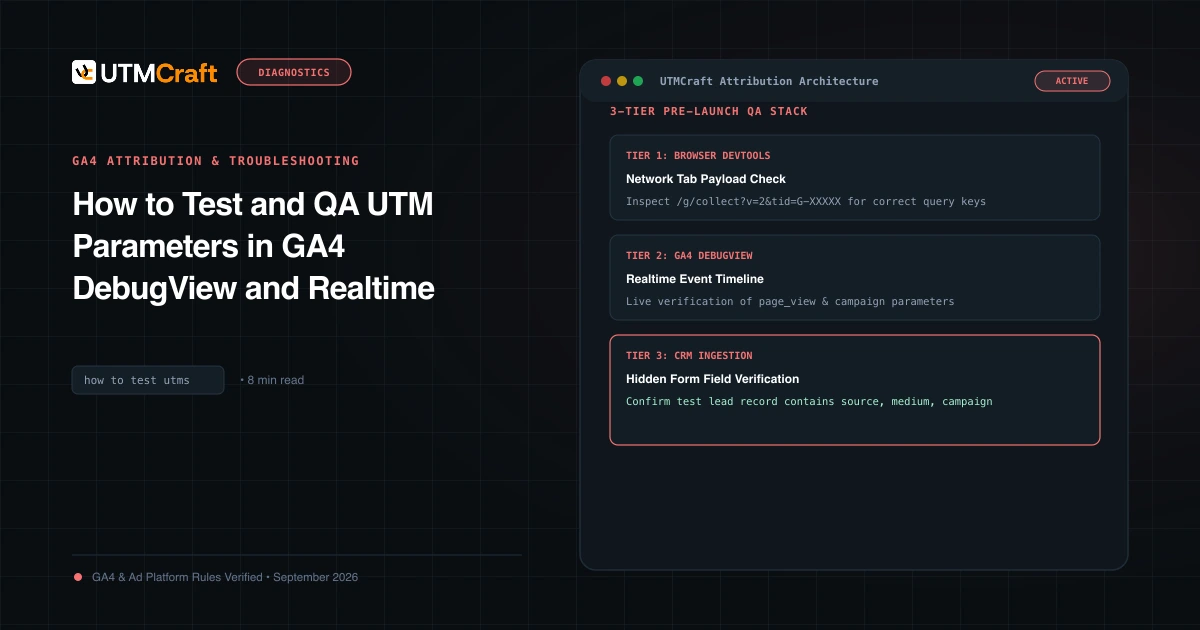
Table of Contents
Do not wait 48 hours for standard GA4 acquisition reports to discover your paid campaign has a broken parameter. By utilizing GA4 DebugView and Realtime reports, you can verify that your UTM parameters, session source, and medium are capturing accurately within 60 seconds.
Why You Must Test Before Spending Ad Dollars
Testing tracking links before launch ensures that:
- Query strings are not stripped by server redirects.
utm_mediumproperly matches GA4 Default Channel Grouping rules.- Form submission capture scripts grab the incoming parameters for your CRM.
Method 1: Testing with GA4 DebugView (Recommended)
DebugView is GA4's premier diagnostic tool. It isolates your test events from production traffic in real time.
- Append
debug_mode=trueto your test campaign link:https://example.com/demo?utm_source=test_source&utm_medium=paid_social&utm_campaign=test_campaign&debug_mode=true - Open the link in an Incognito browser window.
- In GA4, go to Admin > DebugView.
- Select your device from the Debug Device dropdown in the top-left.
- Click the incoming
page_viewandsession_startevents in the waterfall timeline. - Inspect the parameter drawer: verify
source,medium, andcampaigndisplay your test values.
Method 2: Testing with GA4 Realtime Reports
If you prefer not to use debug flags:
- Open your test link in an Incognito window.
- Navigate to Reports > Realtime in GA4.
- Scroll down to the Users by First user source / medium or Users by Session source / medium card.
- Confirm your active session appears under the specified source and medium.
Method 3: Inspecting Network Payloads in Chrome DevTools
For technical marketers who want to inspect the exact outgoing hit before it reaches Google's servers:
- Open Chrome DevTools (F12) and select the Network tab.
- Filter the request list by
collect?v=2. - Refresh your landing page with UTMs.
- Click on the request to
google-analytics.com/g/collect. - Inspect the Payload tab: Look for parameters:
cs= Campaign Source (utm_source)cm= Campaign Medium (utm_medium)cn= Campaign Name (utm_campaign)ck= Campaign Term (utm_term)cc= Campaign Content (utm_content)
Sources & Authoritative References
- Monitor Events in GA4 DebugView (Google Analytics Help)
Related Measurement Guides
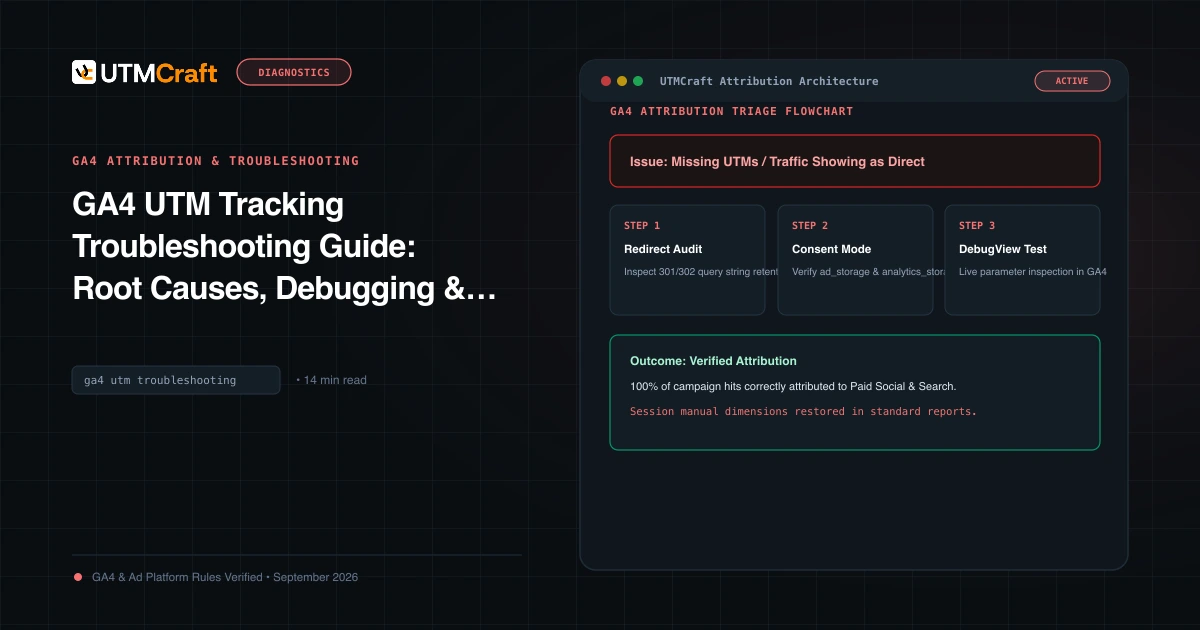
GA4 UTM Tracking Troubleshooting Guide: Root Causes, Debugging & Solutions
Diagnose and fix broken UTM tracking in Google Analytics 4. Comprehensive root cause analysis for Unassigned traffic, Direct spikes, (not set), and stripped query strings.
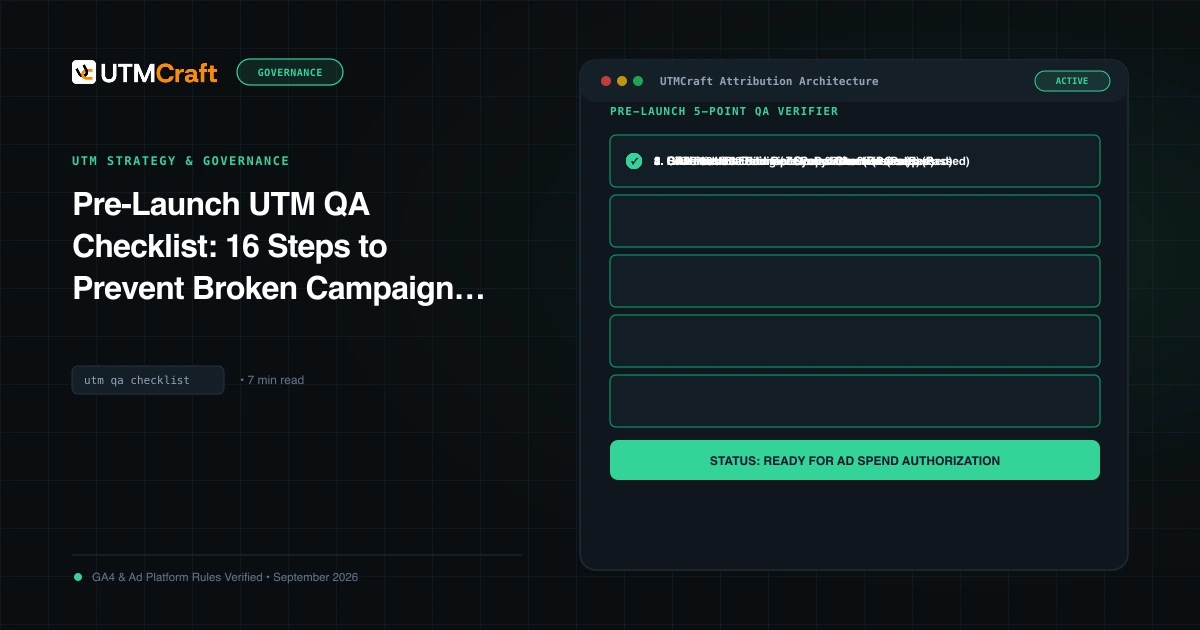
Pre-Launch UTM QA Checklist: 16 Steps to Prevent Broken Campaign Attribution
Prevent broken tracking before you launch. A comprehensive 16-step quality assurance checklist for validating UTM links, redirects, casing, and GA4 DebugView.
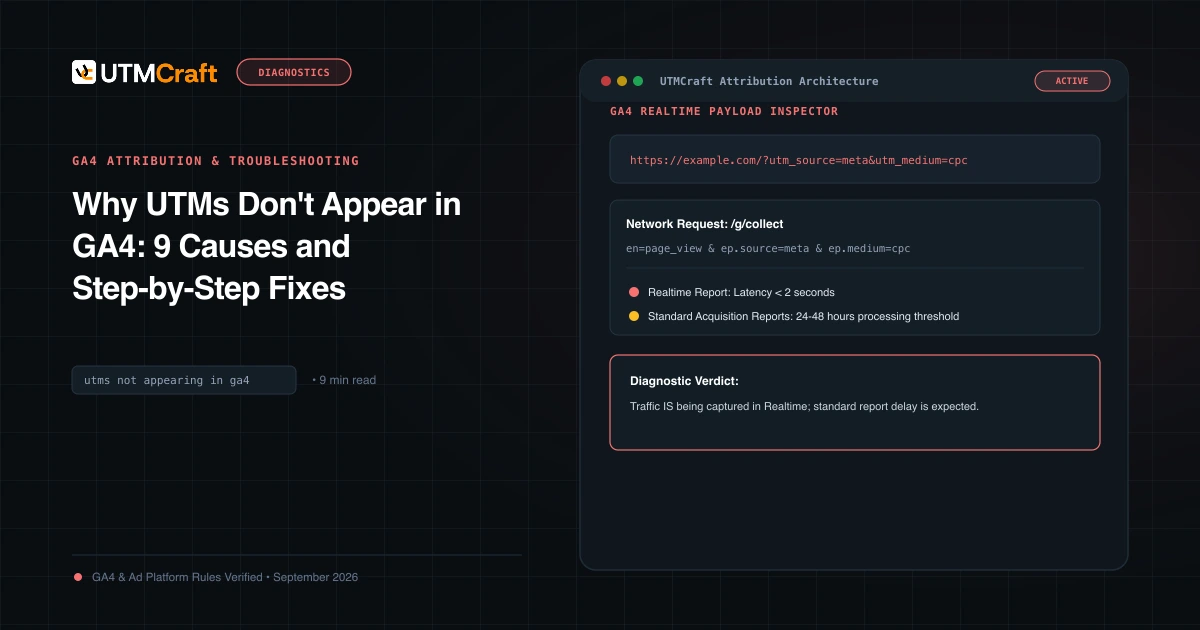
Why UTMs Don't Appear in GA4: 9 Causes and Step-by-Step Fixes
UTM parameters missing in Google Analytics 4? Diagnose the 9 most common reasons campaign data fails to appear in GA4 reports and fix them immediately.